Do you analyze data for a city, town, or utility? ... And do you wonder how you can graphically analyze your data? Here are 24 examples to help you!
Click the screen-captures below to go to the samples page, where you can see the full-size interactive samples (and also download the SAS code used to create all of them!)
Or, if you prefer something more text-based (so you can use text searches in this blog, instead of going to the samples page), here are text descriptions and direct links to each of the 24 examples:
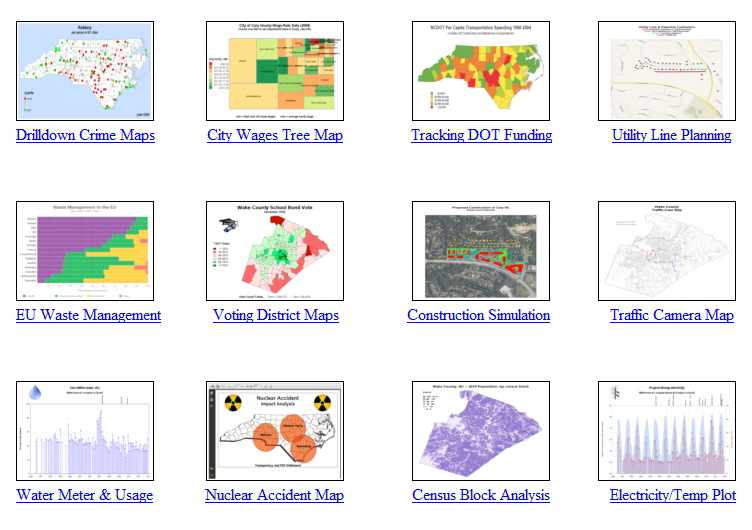
Crime maps showing the cities of North Carolina, shaded by their crime rates.
City wages tree map, for the city of Cary, North Carolina.
Department of Transportation (DOT) funding per-capita map, shaded by county.
Utility line, and potential customers map.
Waste management (in the European Union) stacked bar chart.
School bond vote outcome map, by voting district.
Construction project overlaid on satellite map.
Traffic cam map, with pop-up image for each traffic camera.
Water usage map for 1 house, detecting water leak.
Nuclear power plant accident map.
Census block map, showing population.
Electric usage, and outdoor temperature graph.
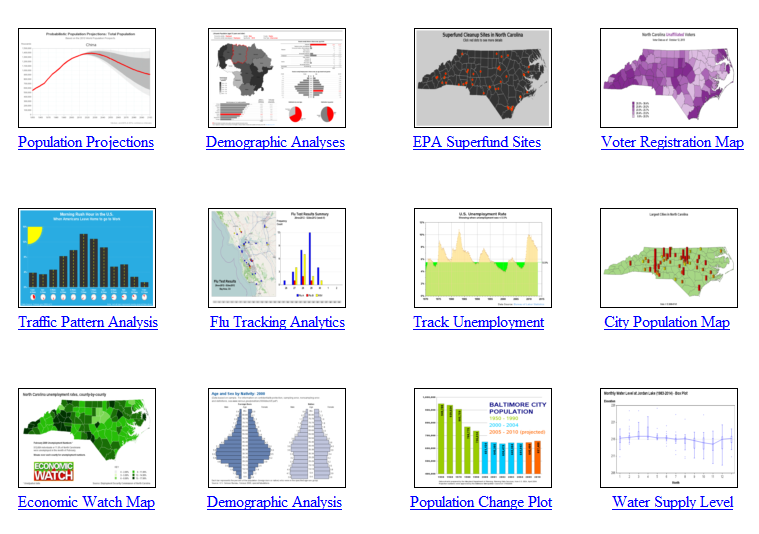
Population projection graphs, with confidence interval.
Demographic analysis dashboard.
Environmental Protection Agency (EPA) superfund cleanup sites map.
Voter registration maps, by county (republican, democrat, and unaffiliated).
Rush hour traffic analysis chart.
Flu epidemic tracking map.
Unemployment rate above/below waterline.
3d city population bars, plotted on state map.
Unemployment map, by county.
Population tree graph comparison.
Tracking population change over time.
City water supply lake level time series graph.
Hopefully you'll find these examples useful - and let me know if there are any other types of graphs or maps you would like to have added to this collection!